In this post, I'll explain advanced techniques to debug native code in Electron apps (specifically, native Node.js addons) using lldb and Xcode.
You might be interested in this post if you have an Electron app, use native Node.js addons (like sqlite3, nodegit, or java), and recently encountered an issue that requires you to understand the running code better. In my case, I upgraded Notion to Electron v26 and promptly encountered segmentation faults originating in better-sqlite3.
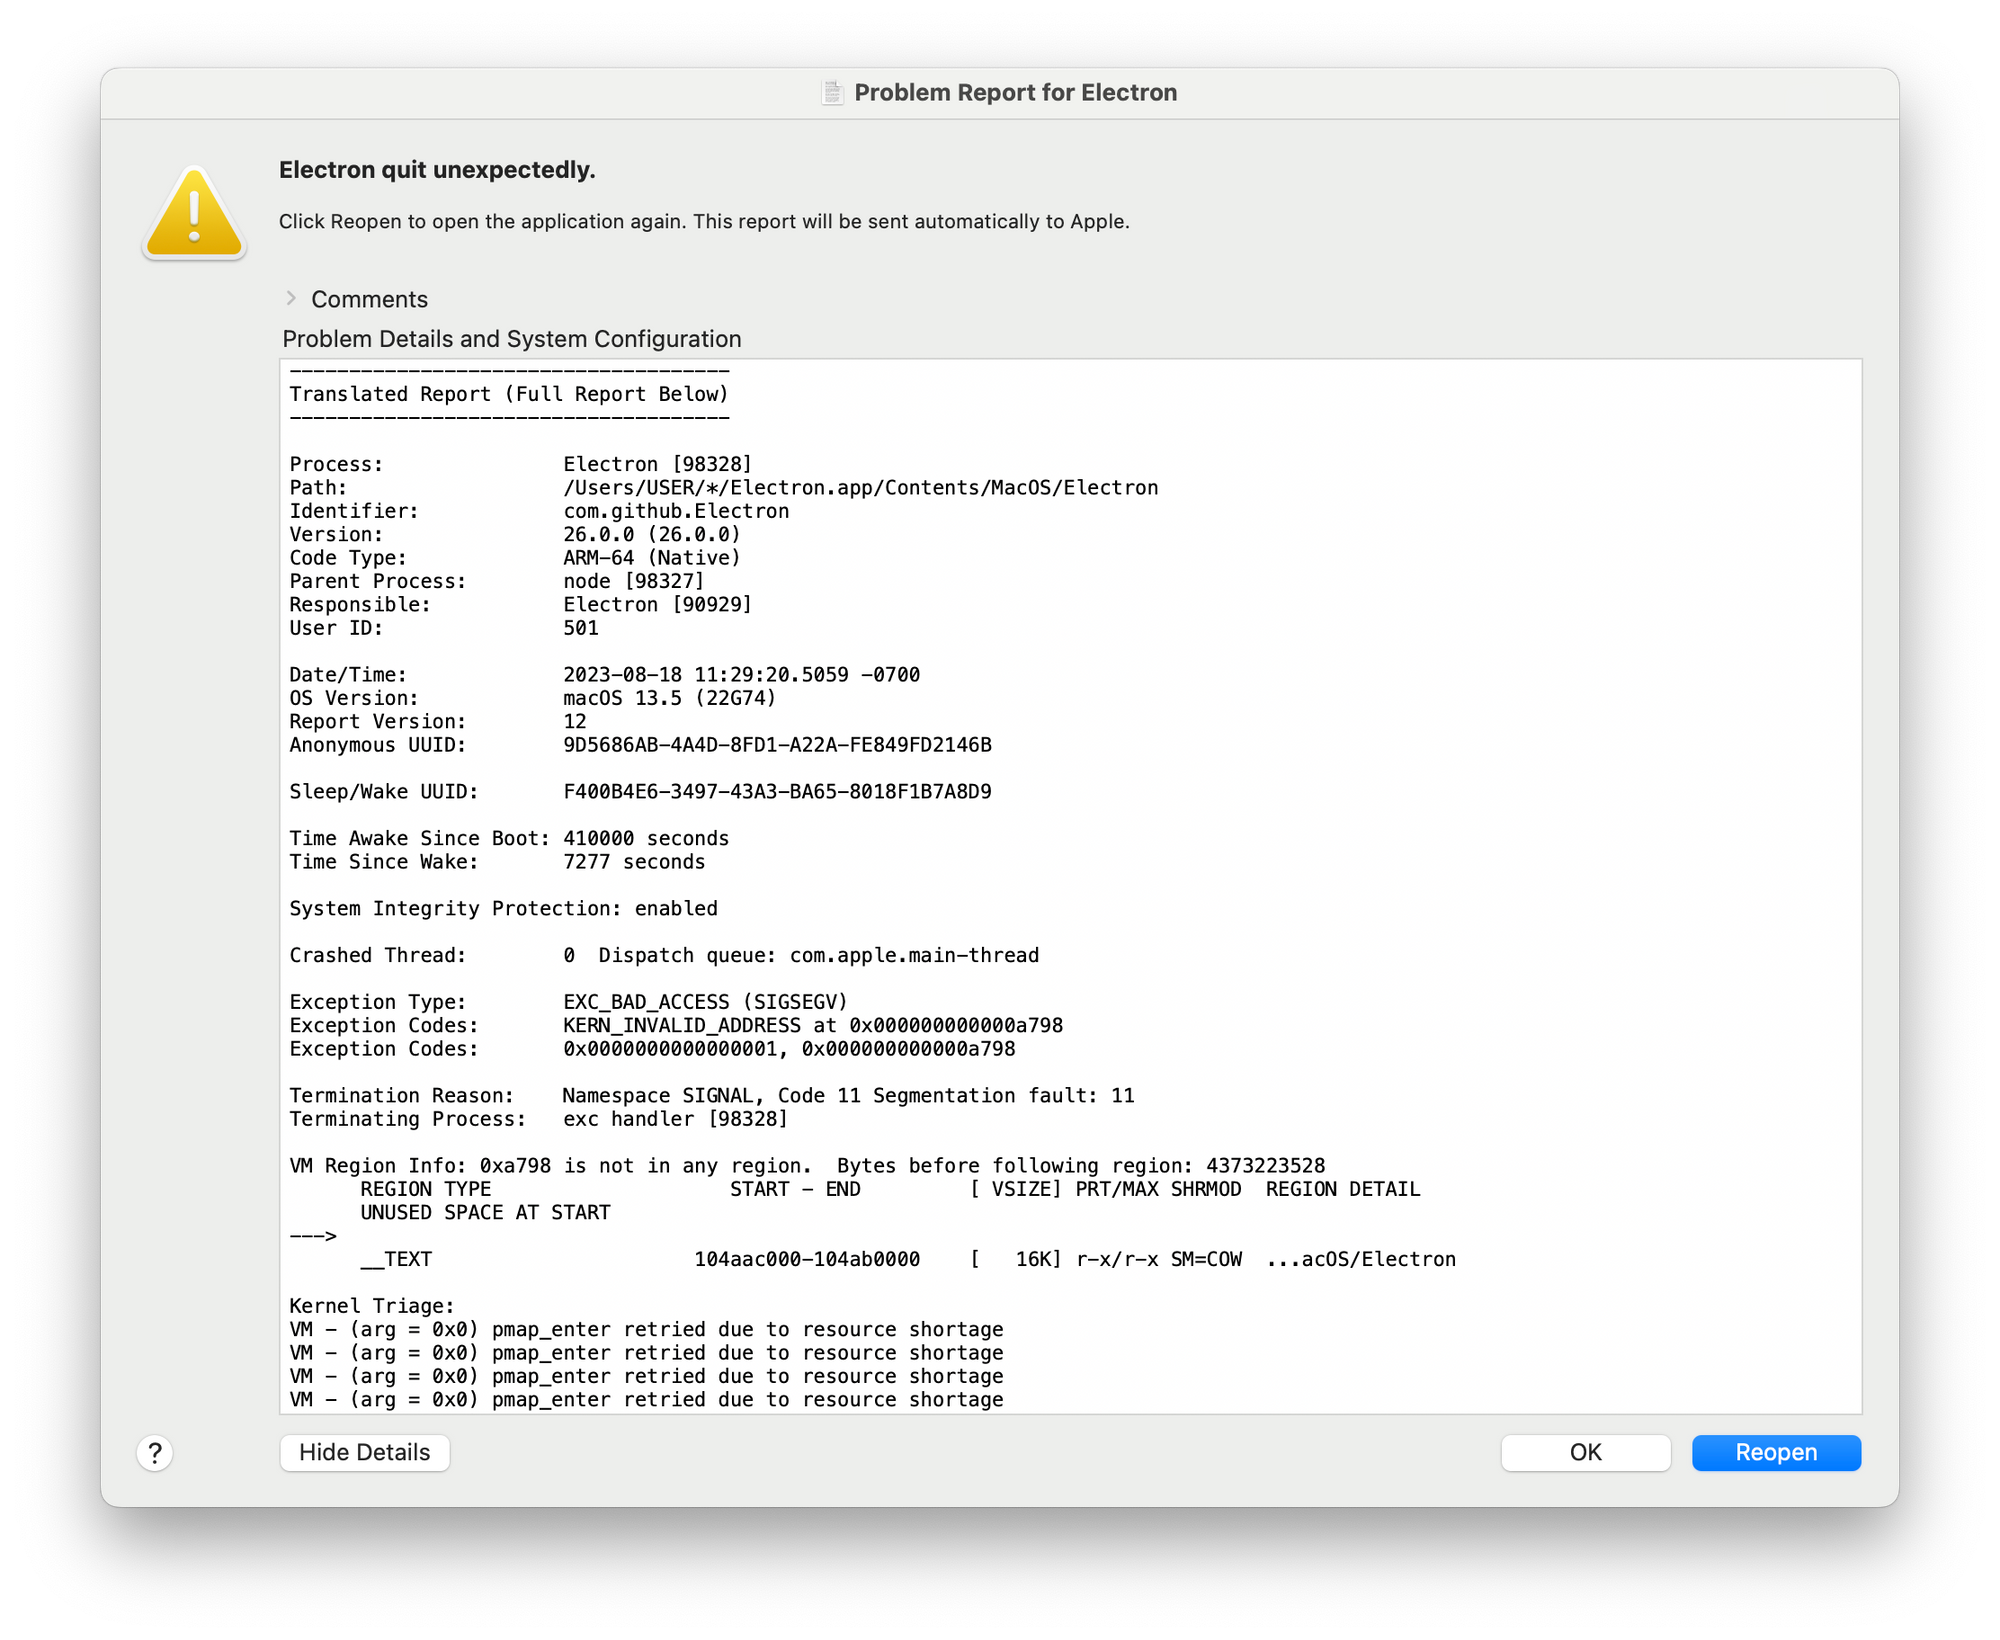
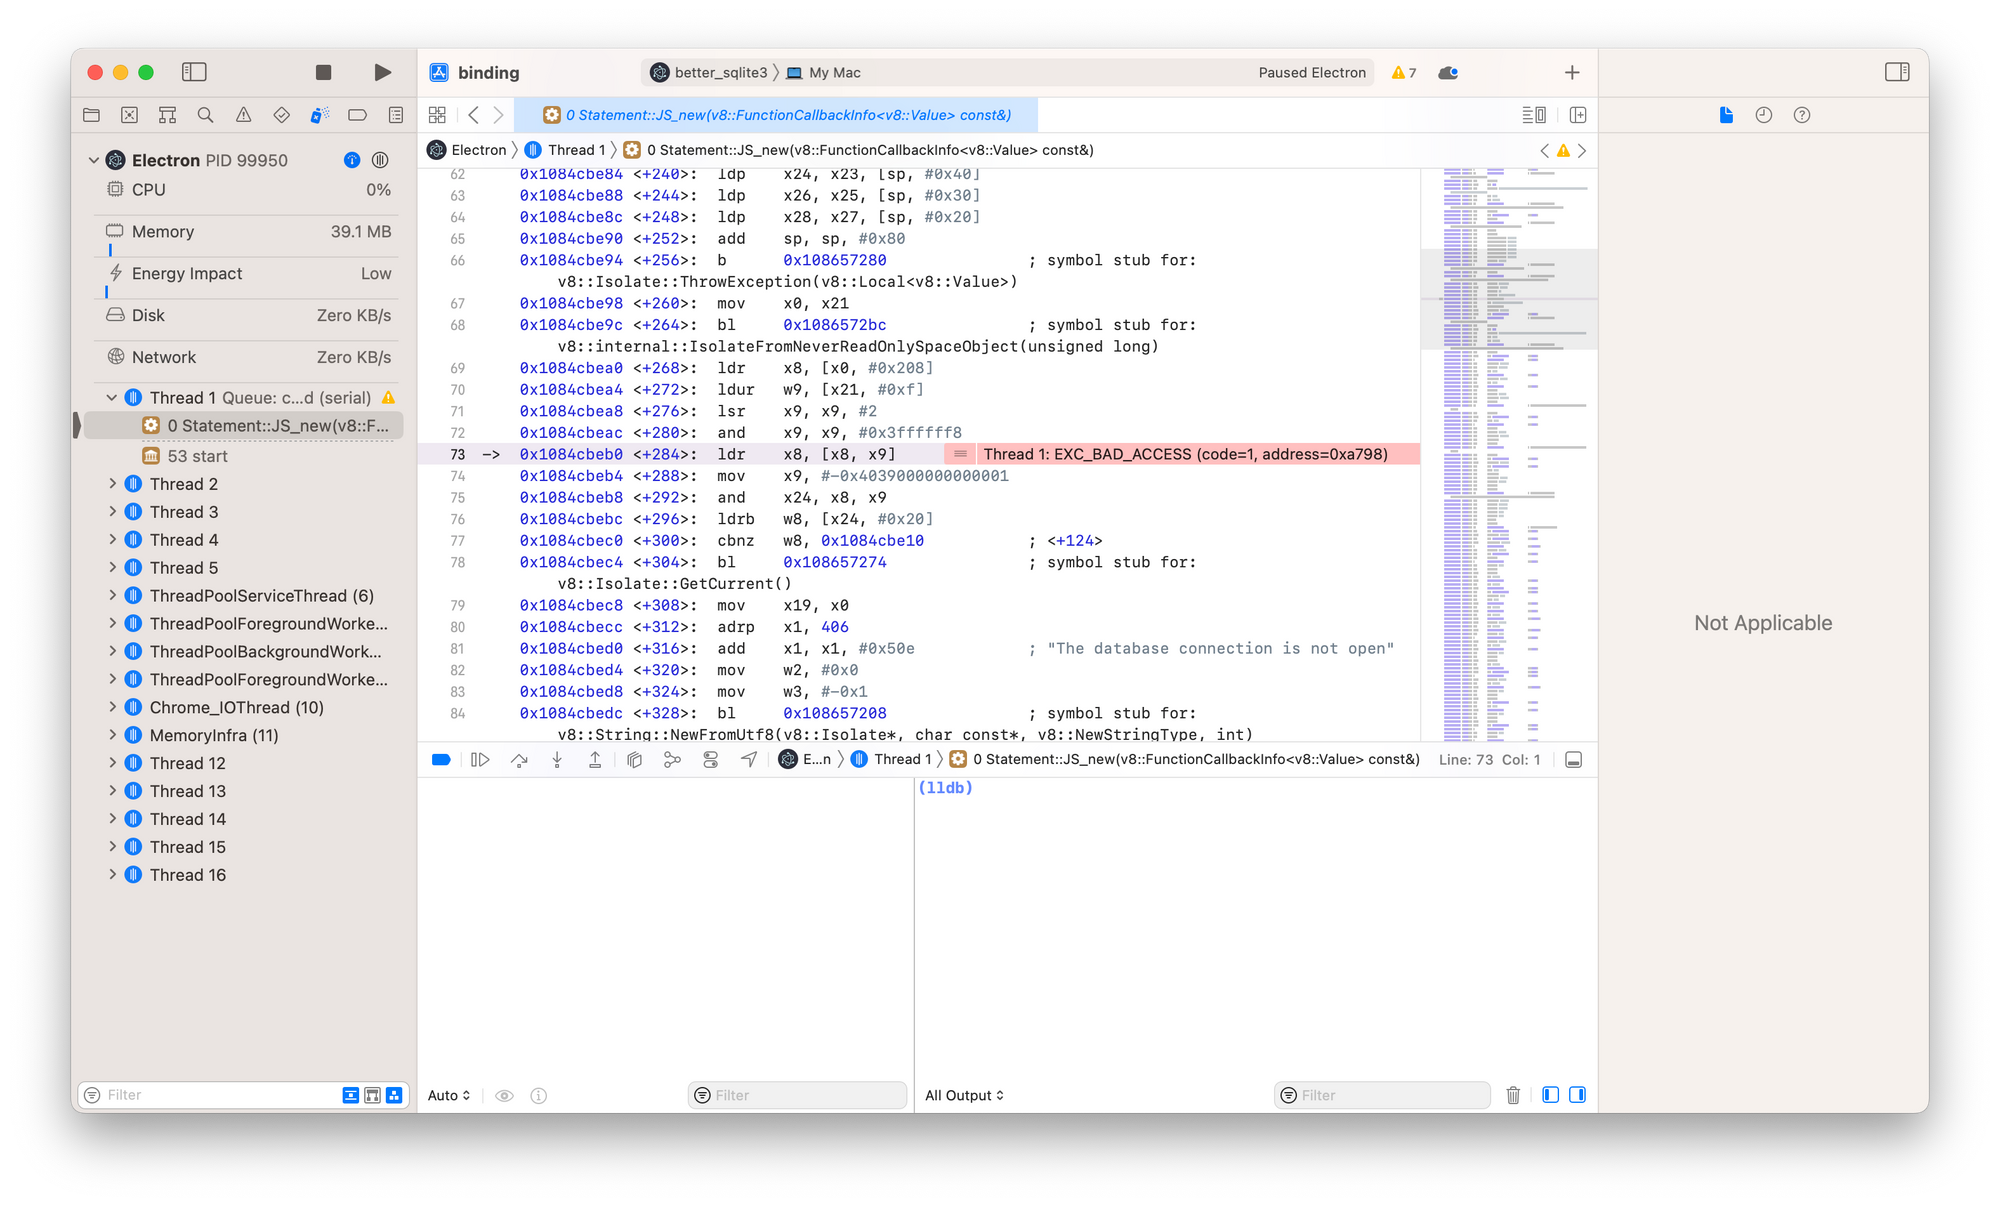
When scrolling down in the crash dialog above, we can see that the crashing module was better_sqlite3. The better_sqlite3.node here at position 0 is our indicator that we should take a closer look at said module.
Thread 0 Crashed:: CrBrowserMain Dispatch queue: com.apple.main-thread
0   better_sqlite3.node           	       0x11bb03eb0 Statement::JS_new(v8::FunctionCallbackInfo<v8::Value> const&) + 284
1   Electron Framework            	       0x10a7dbac8 v8::internal::Accessors::MakeAccessor(v8::internal::Isolate*, v8::internal::Handle<v8::internal::Name>, void (*)(v8::Local<v8::Name>, v8::PropertyCallbackInfo<v8::Value> const&), void (*)(v8::Local<v8::Name>, v8::Local<v8::Value>, v8::PropertyCallbackInfo<v8::Boolean> const&)) + 14000
2   Electron Framework            	       0x10a7db688 v8::internal::Accessors::MakeAccessor(v8::internal::Isolate*, v8::internal::Handle<v8::internal::Name>, void (*)(v8::Local<v8::Name>, v8::PropertyCallbackInfo<v8::Value> const&), void (*)(v8::Local<v8::Name>, v8::Local<v8::Value>, v8::PropertyCallbackInfo<v8::Boolean> const&)) + 12912
In order to debug the crash in more detail, we'll do the following:
- Build our native Node addon
better_sqlite3indebugmode - Create an Xcode project for our Node addon
- Debug that addon from within Xcode
Build in debug mode
Many of the build or rebuild tools accept a --debugflag to build addons in debug mode.
- If you're using
@electron/rebuildorelectron-rebuild, pass the `--debug` flag directly to your debug command. As an example, usenpx @electron/rebuild -v 26.0.0 -f -w better-sqlite3. - If you're using
electron-forge, add adebug: trueto yourrebuildConfiginside your configuration. - If you're using
electron-builder, it might be easier to create a dummy project that doesn't useelectron-builderjust so that you can run and configure@electron/rebuildyourself.
In this example, I have an Electron project with the following two files:
{
  "name": "test-app",
  "main": "./main.js",
  "version": "1.0.0",
  "scripts": {
    "start": "electron .",
    "rebuild": "npx @electron/rebuild --debug  -f -w better-sqlite3"
  },
  "dependencies": {
    "better-sqlite3": "^8.5.1"
  },
  "devDependencies": {
    "electron": "26.0.0"
  }
}const sqlite = require('better-sqlite3')
function setupDatabase() {
const db = sqlite('foobar.db');
const row = db.prepare('SELECT * FROM users')
}
setupDatabase()In order to create a debug build of better-sqlite3, I run npm run rebuild.
Create an Xcode project
Now we need to create Xcode projects for our addon. To do that, we first cd into our addon folder and then run node-gyp manually:
# Enter my native addon's folder
cd node_modules/better_sqlite3

# Install node-gyp
npm i -g node-gyp

# Ensure we don't cache in a weird directory
export HOME=~/.electron-gyp

# Create Xcode project
node-gyp configure --debug --target=26.0.0 --arch=arm64 --dist-url=https://electronjs.org/headers -- -f xcode
node-gyp rebuild --debug --target=26.0.0 --arch=arm64 --dist-url=https://electronjs.org/headers
You should now have an *.xcodeproj file in your build folder. In my case, that's binding.xcodeproj, so we'll open it up with:
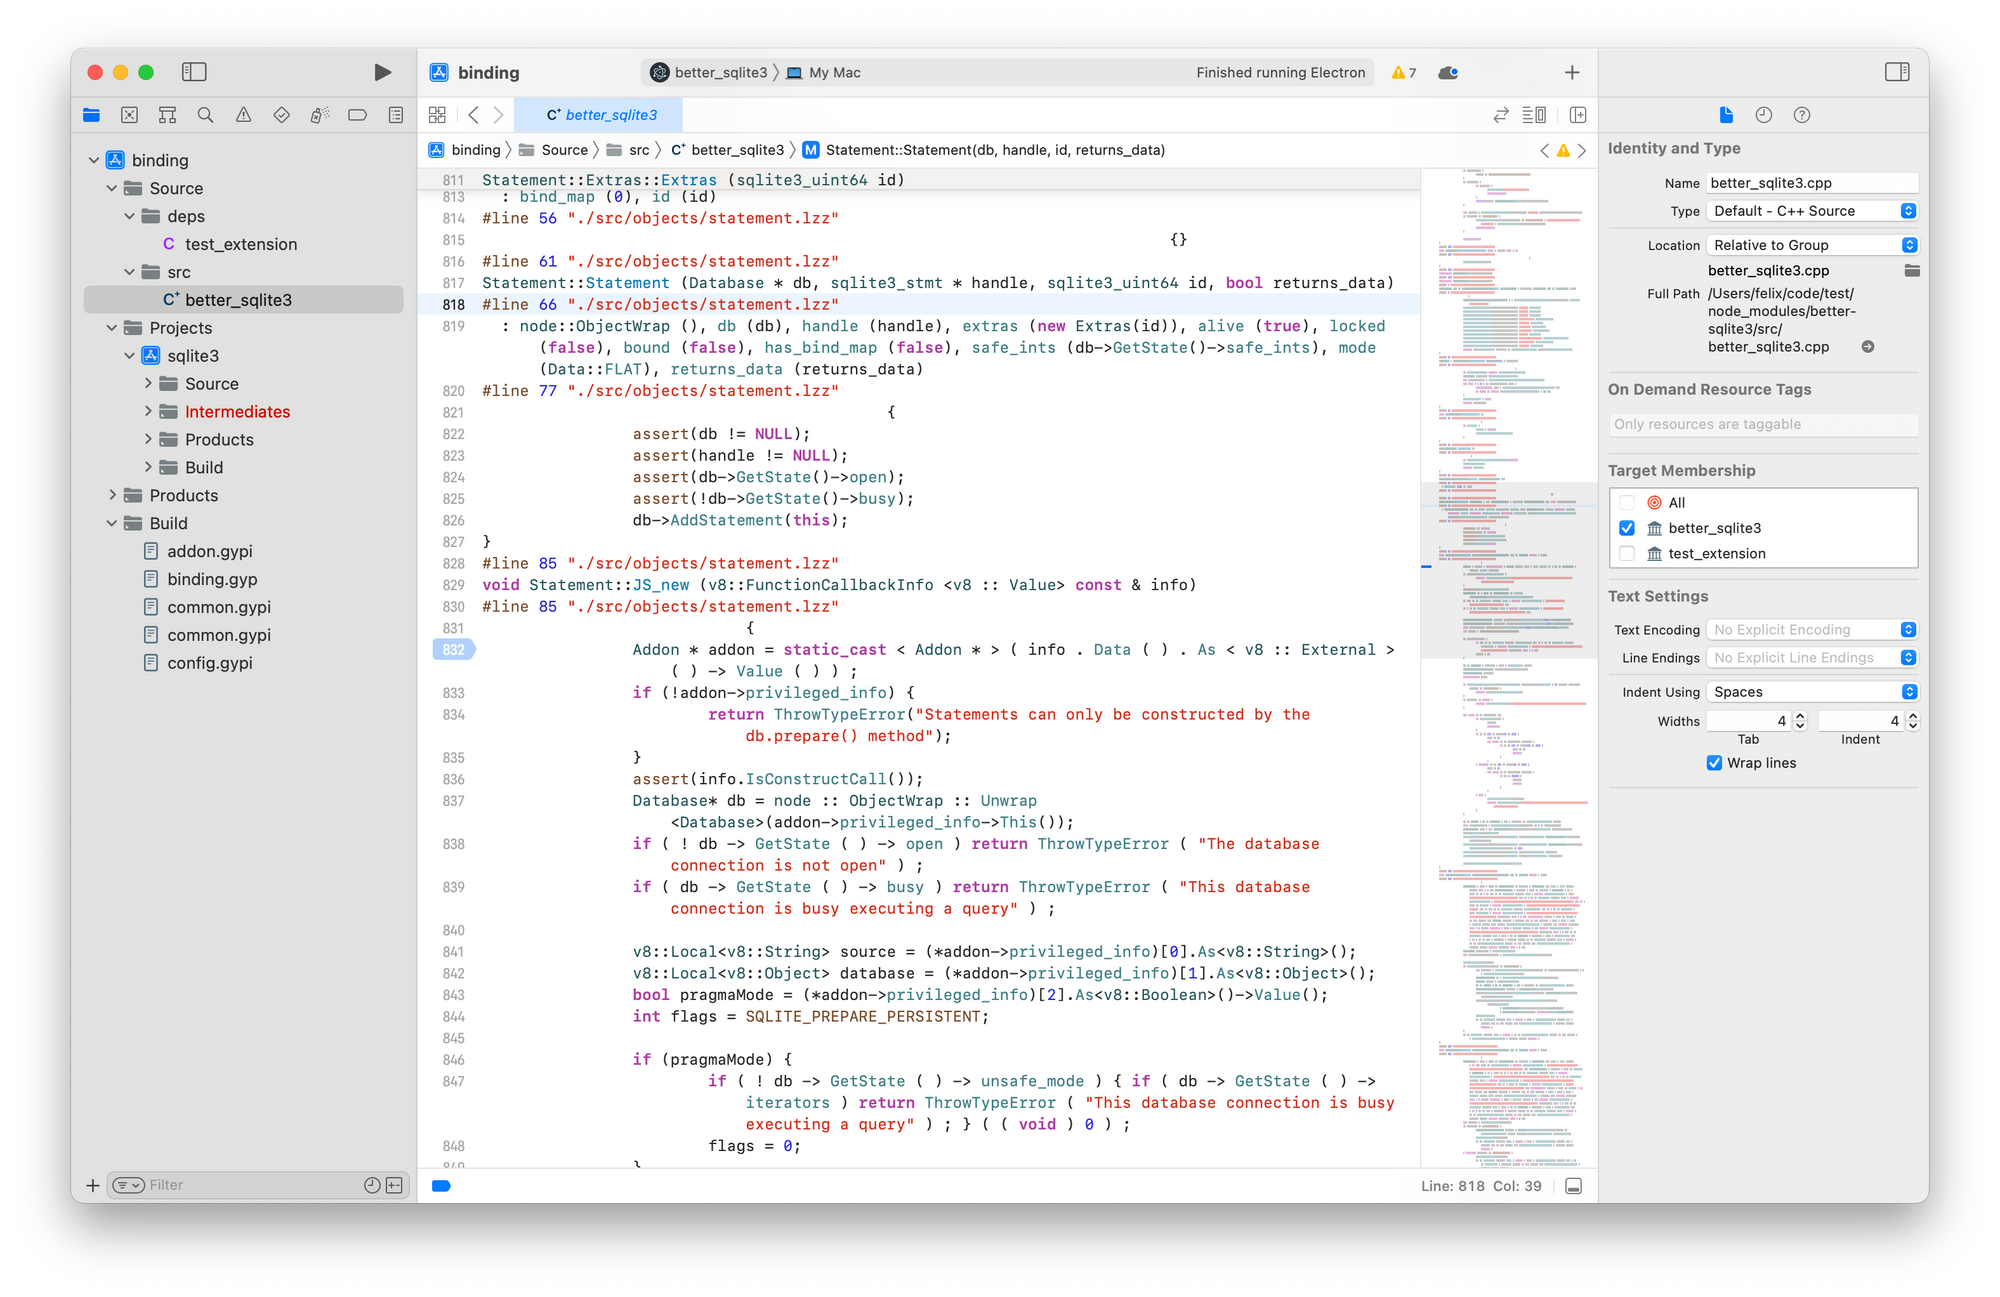
open build/binding.xcodeprojDebug with Xcode
We now have an Xcode project where we can set breakpoints, explore our code, and eventually use Xcode's UI to make lldb a bit more usable.
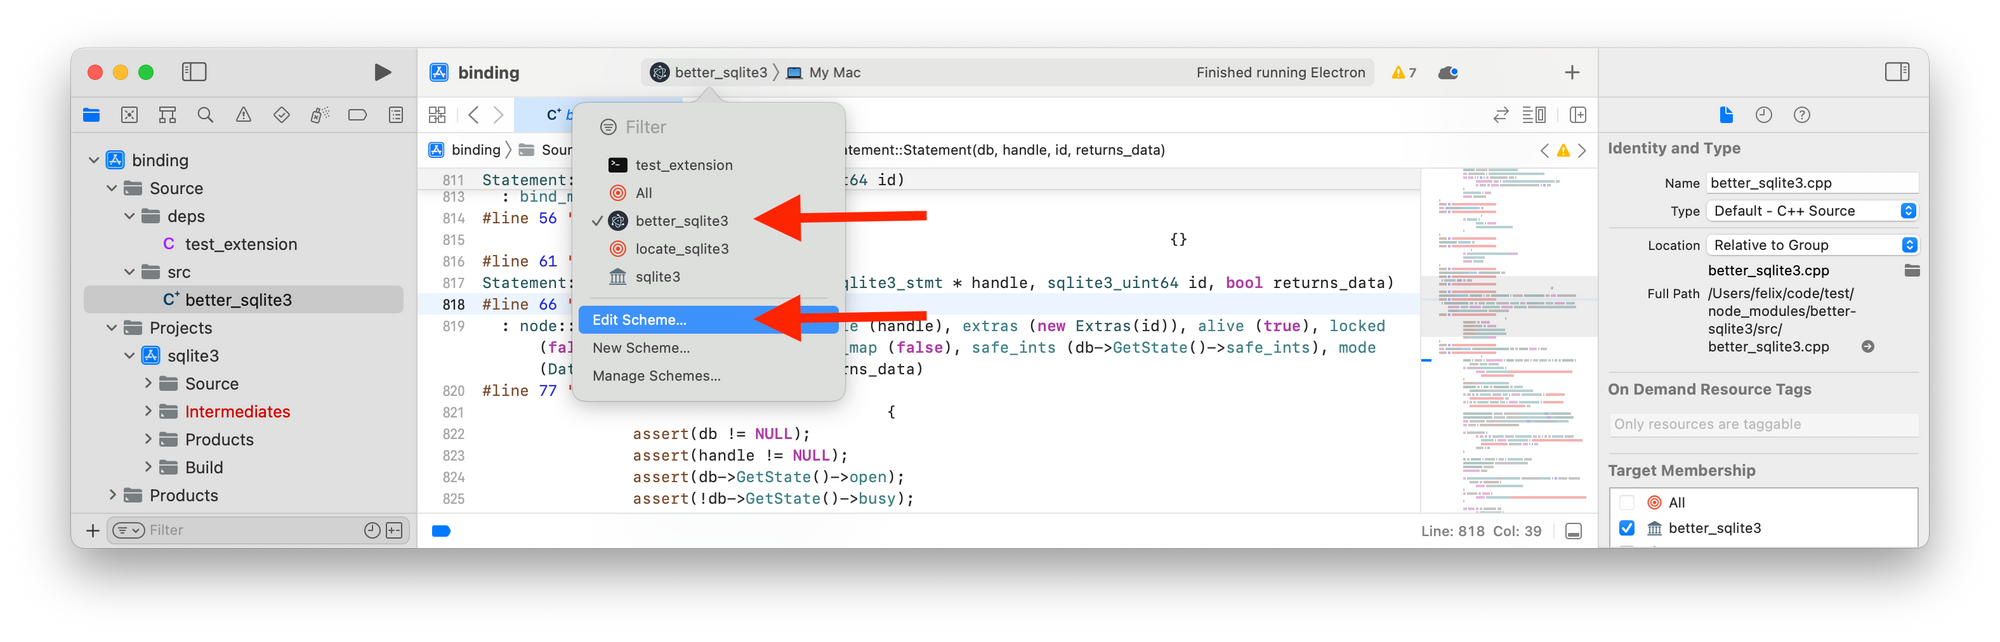
Before we can debug, we need to teach Xcode how to run our code. First, select the correct scheme — it should have the same name as the addon that you're suspecting. Then, click on Edit Scheme... to configure it.
As the executable, select the Electron.app that's used to run your app. It's most likely found inside node_modules/electron/dist.
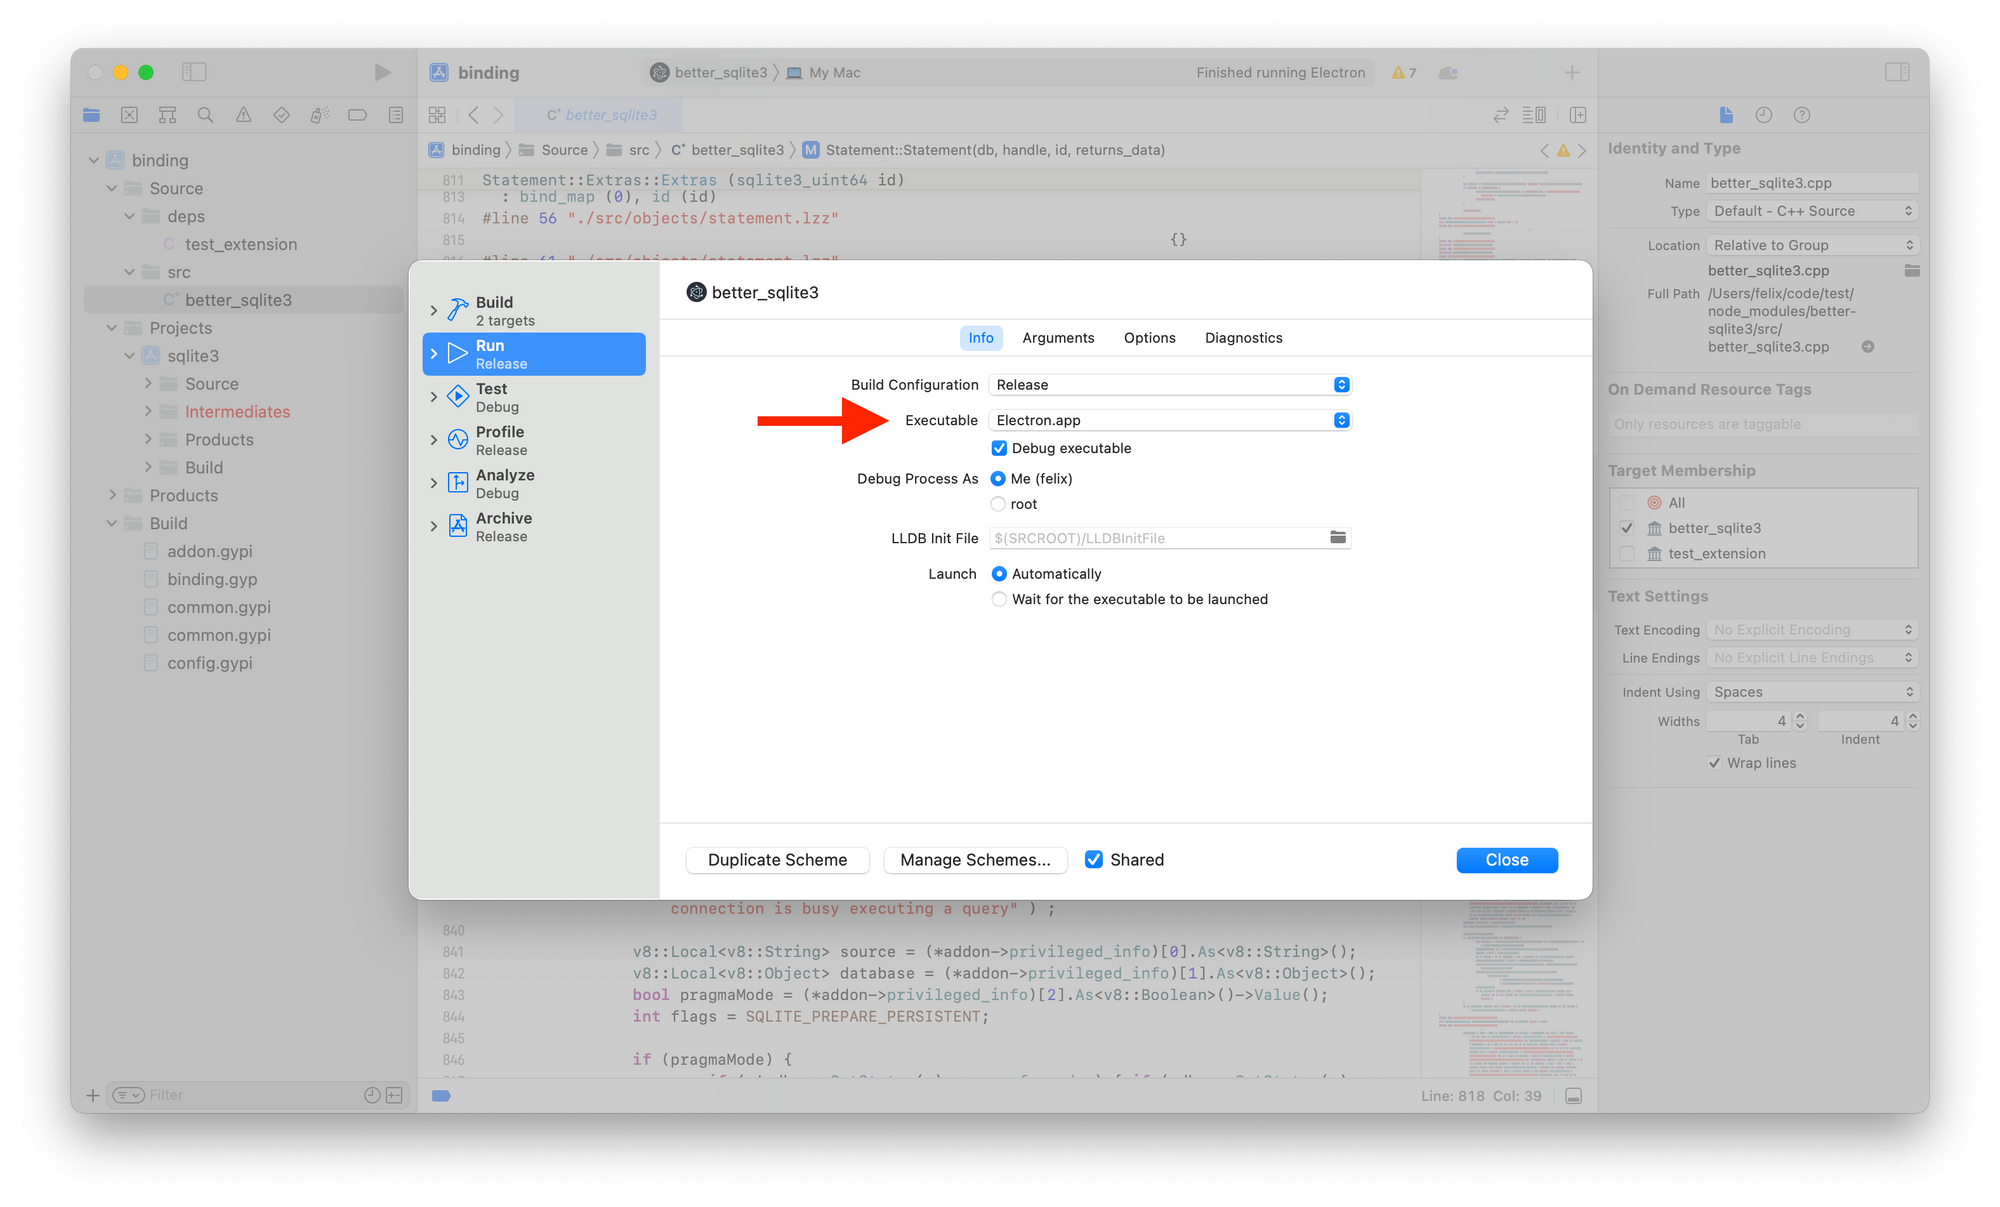
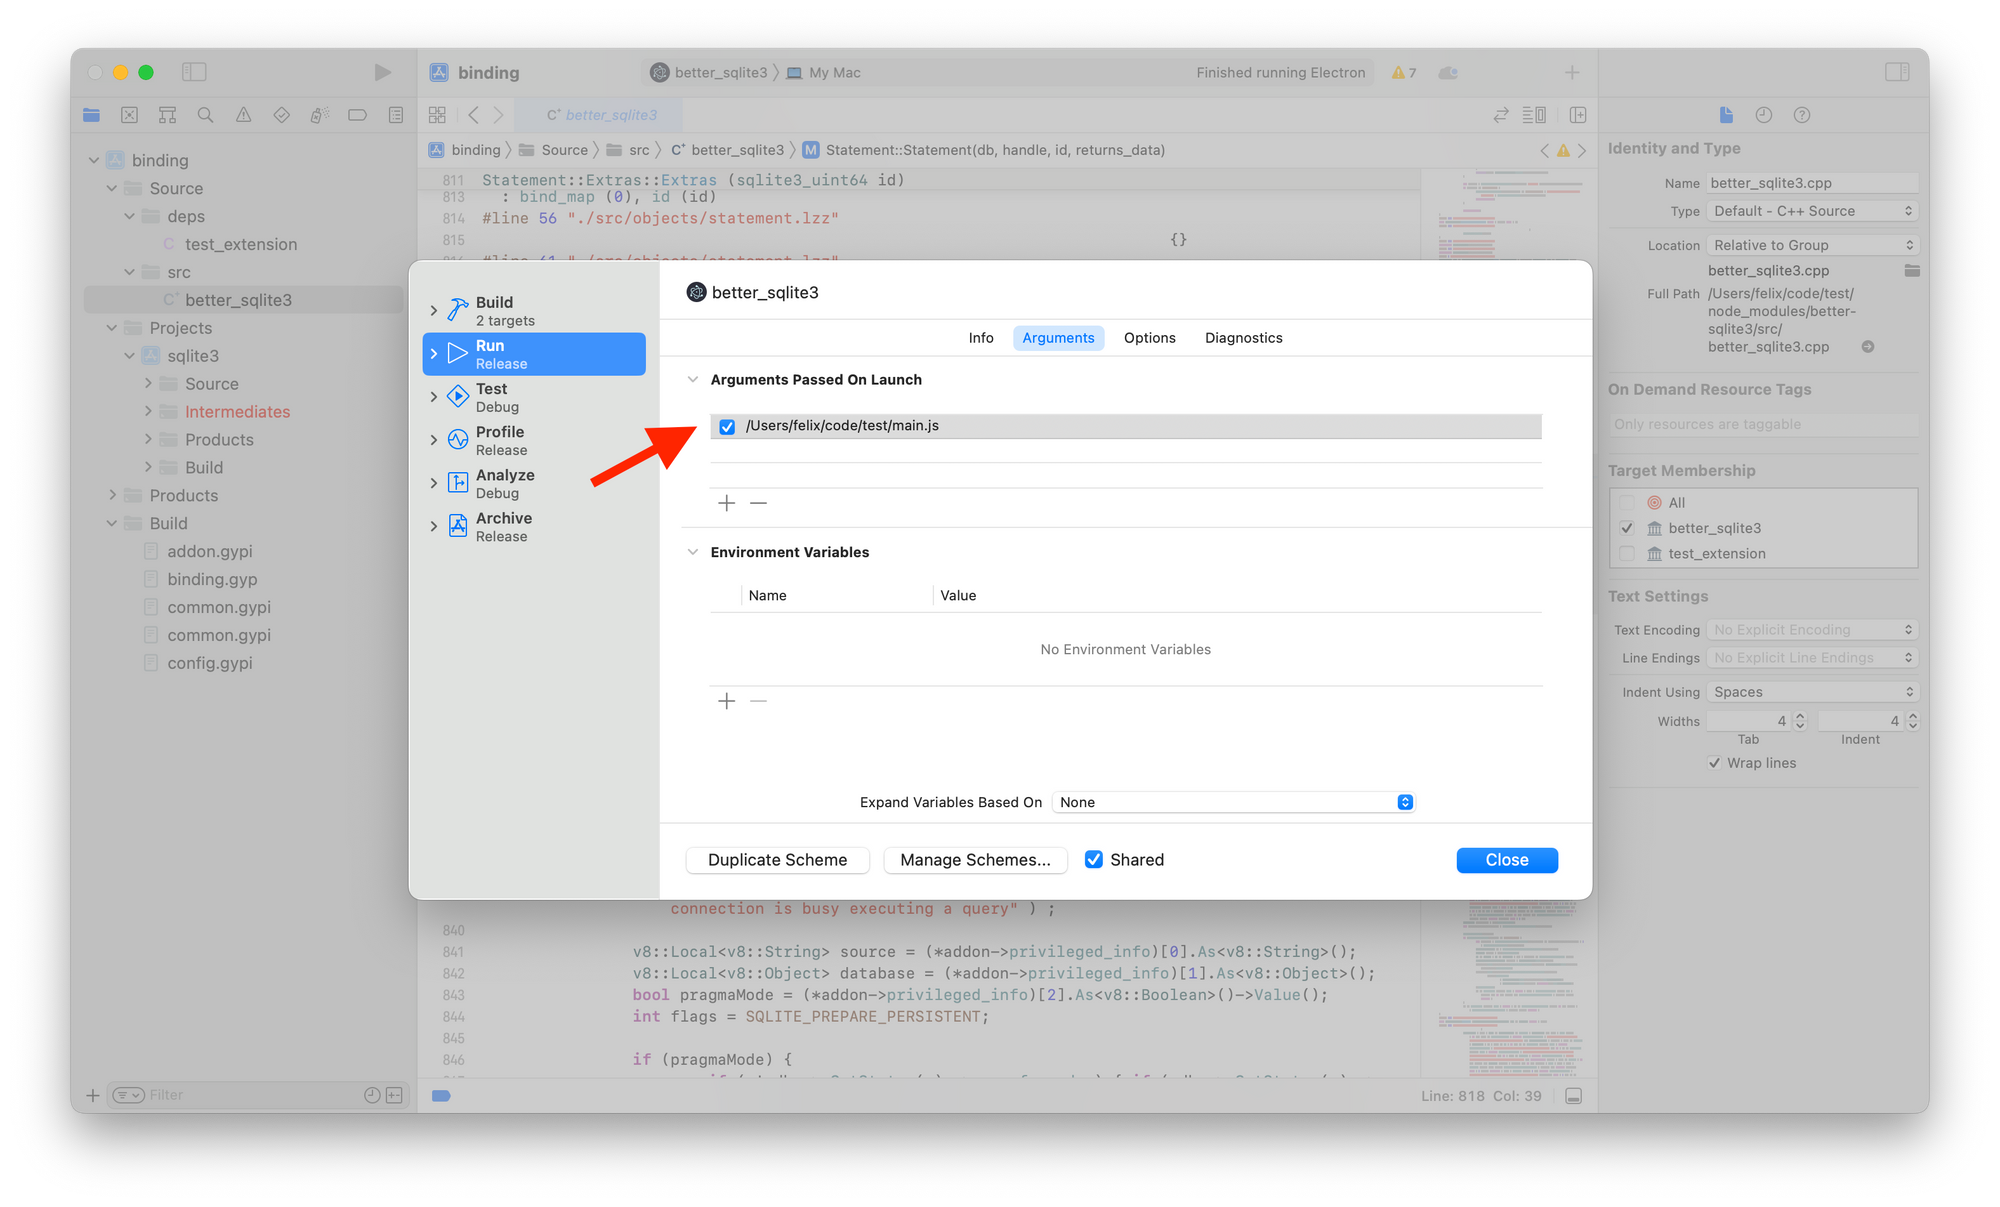
Then, make sure that Electron is launched with your app as an argument. Select the Arguments tab and pass in the entire path to your app's main file (in my case, main.js)
Now we're ready to debug our app! One important thing: By default, when you hit the "Play" button, Xcode will recompile your native addon. It'll do so for your local version of Node.js, not using the version of Electron you'll likely want to build for. You could configure node-gyp to understand that — I usually just use Xcode's Run without building feature.
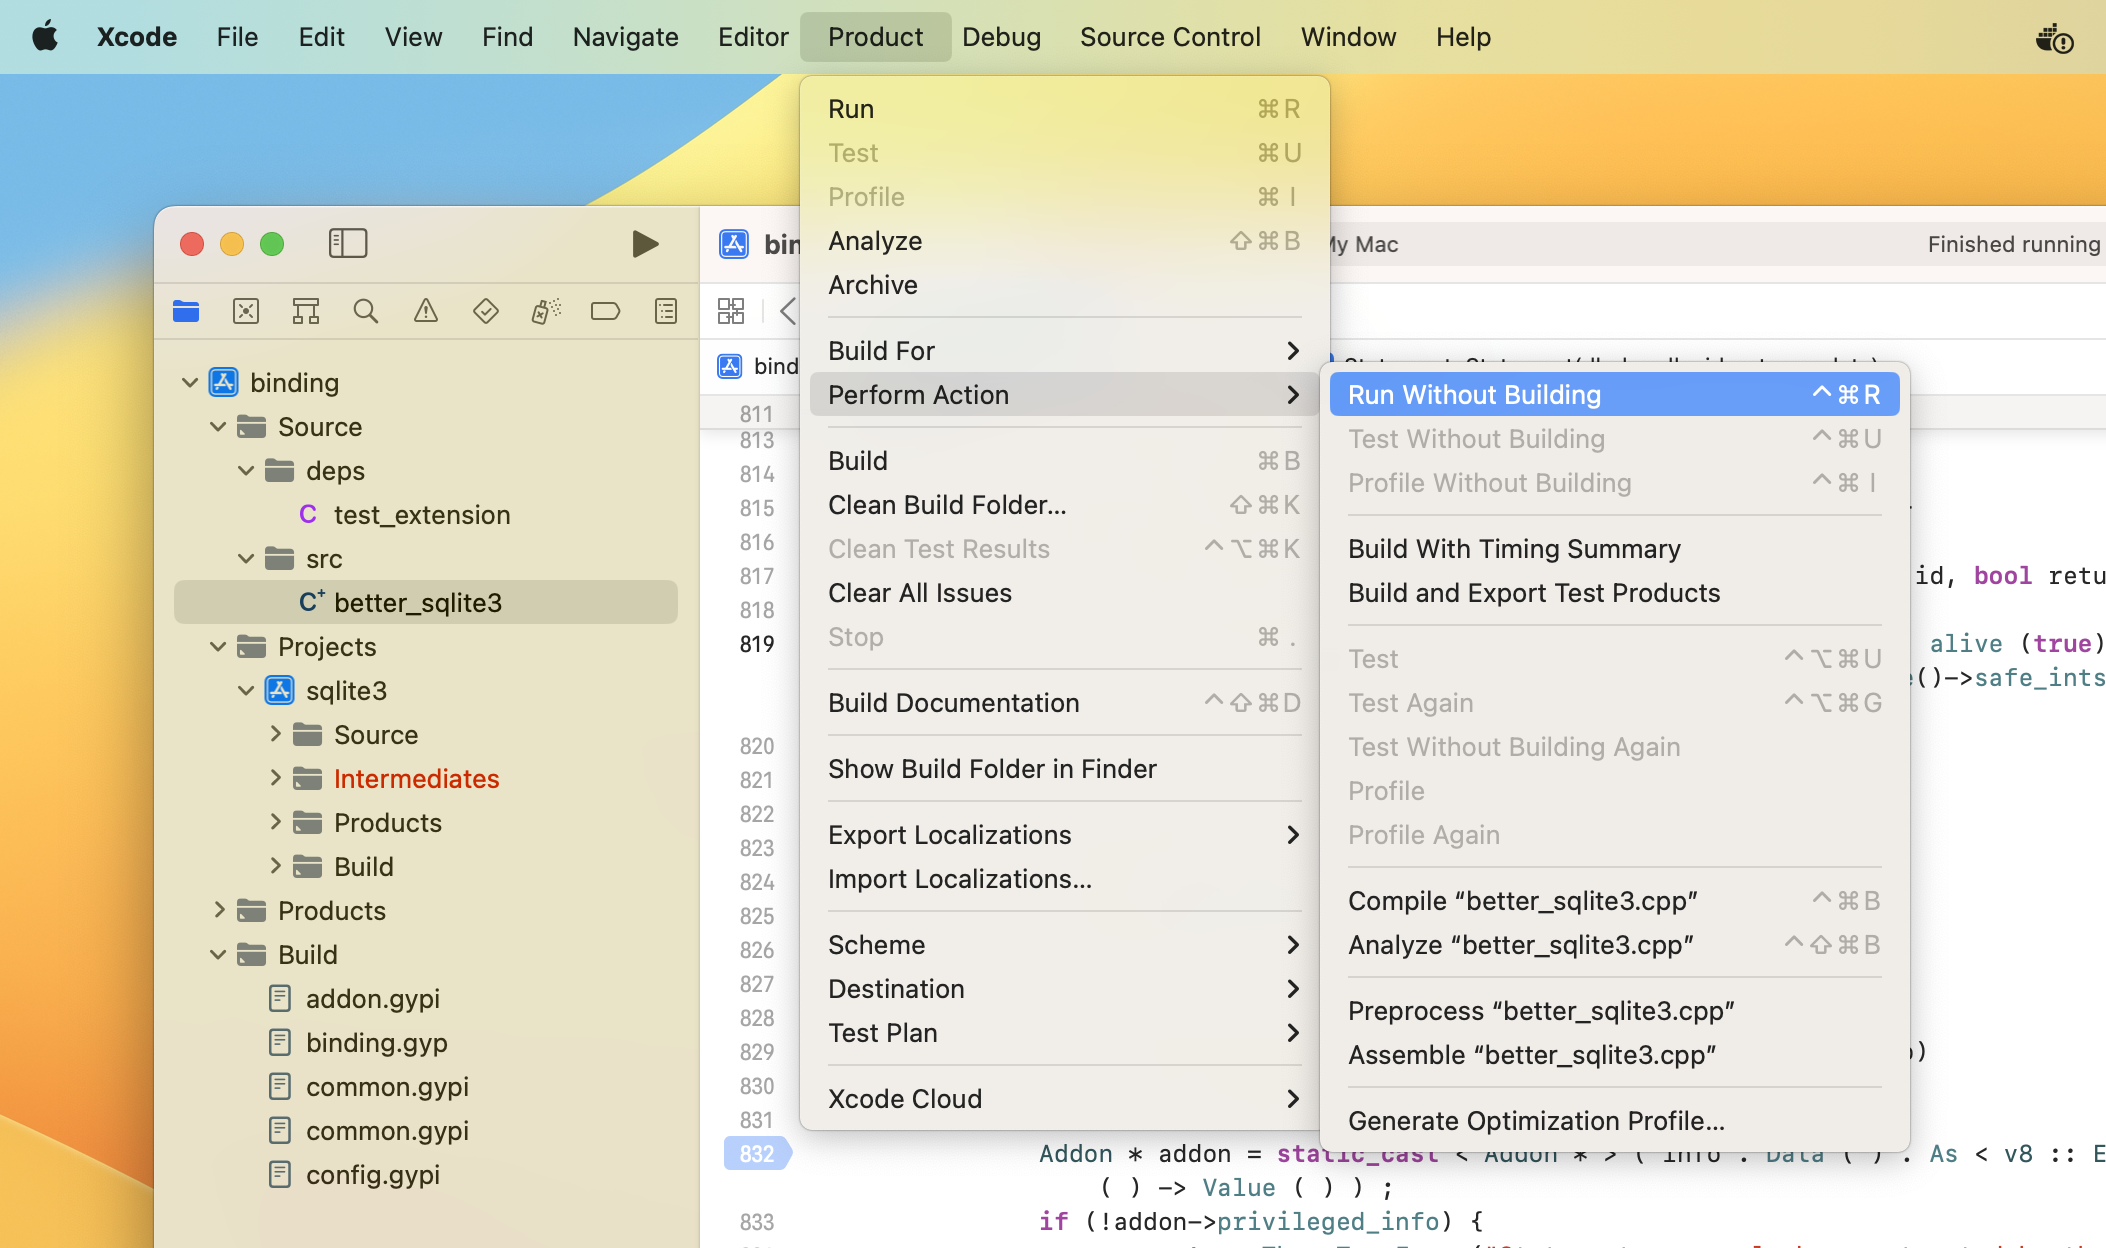
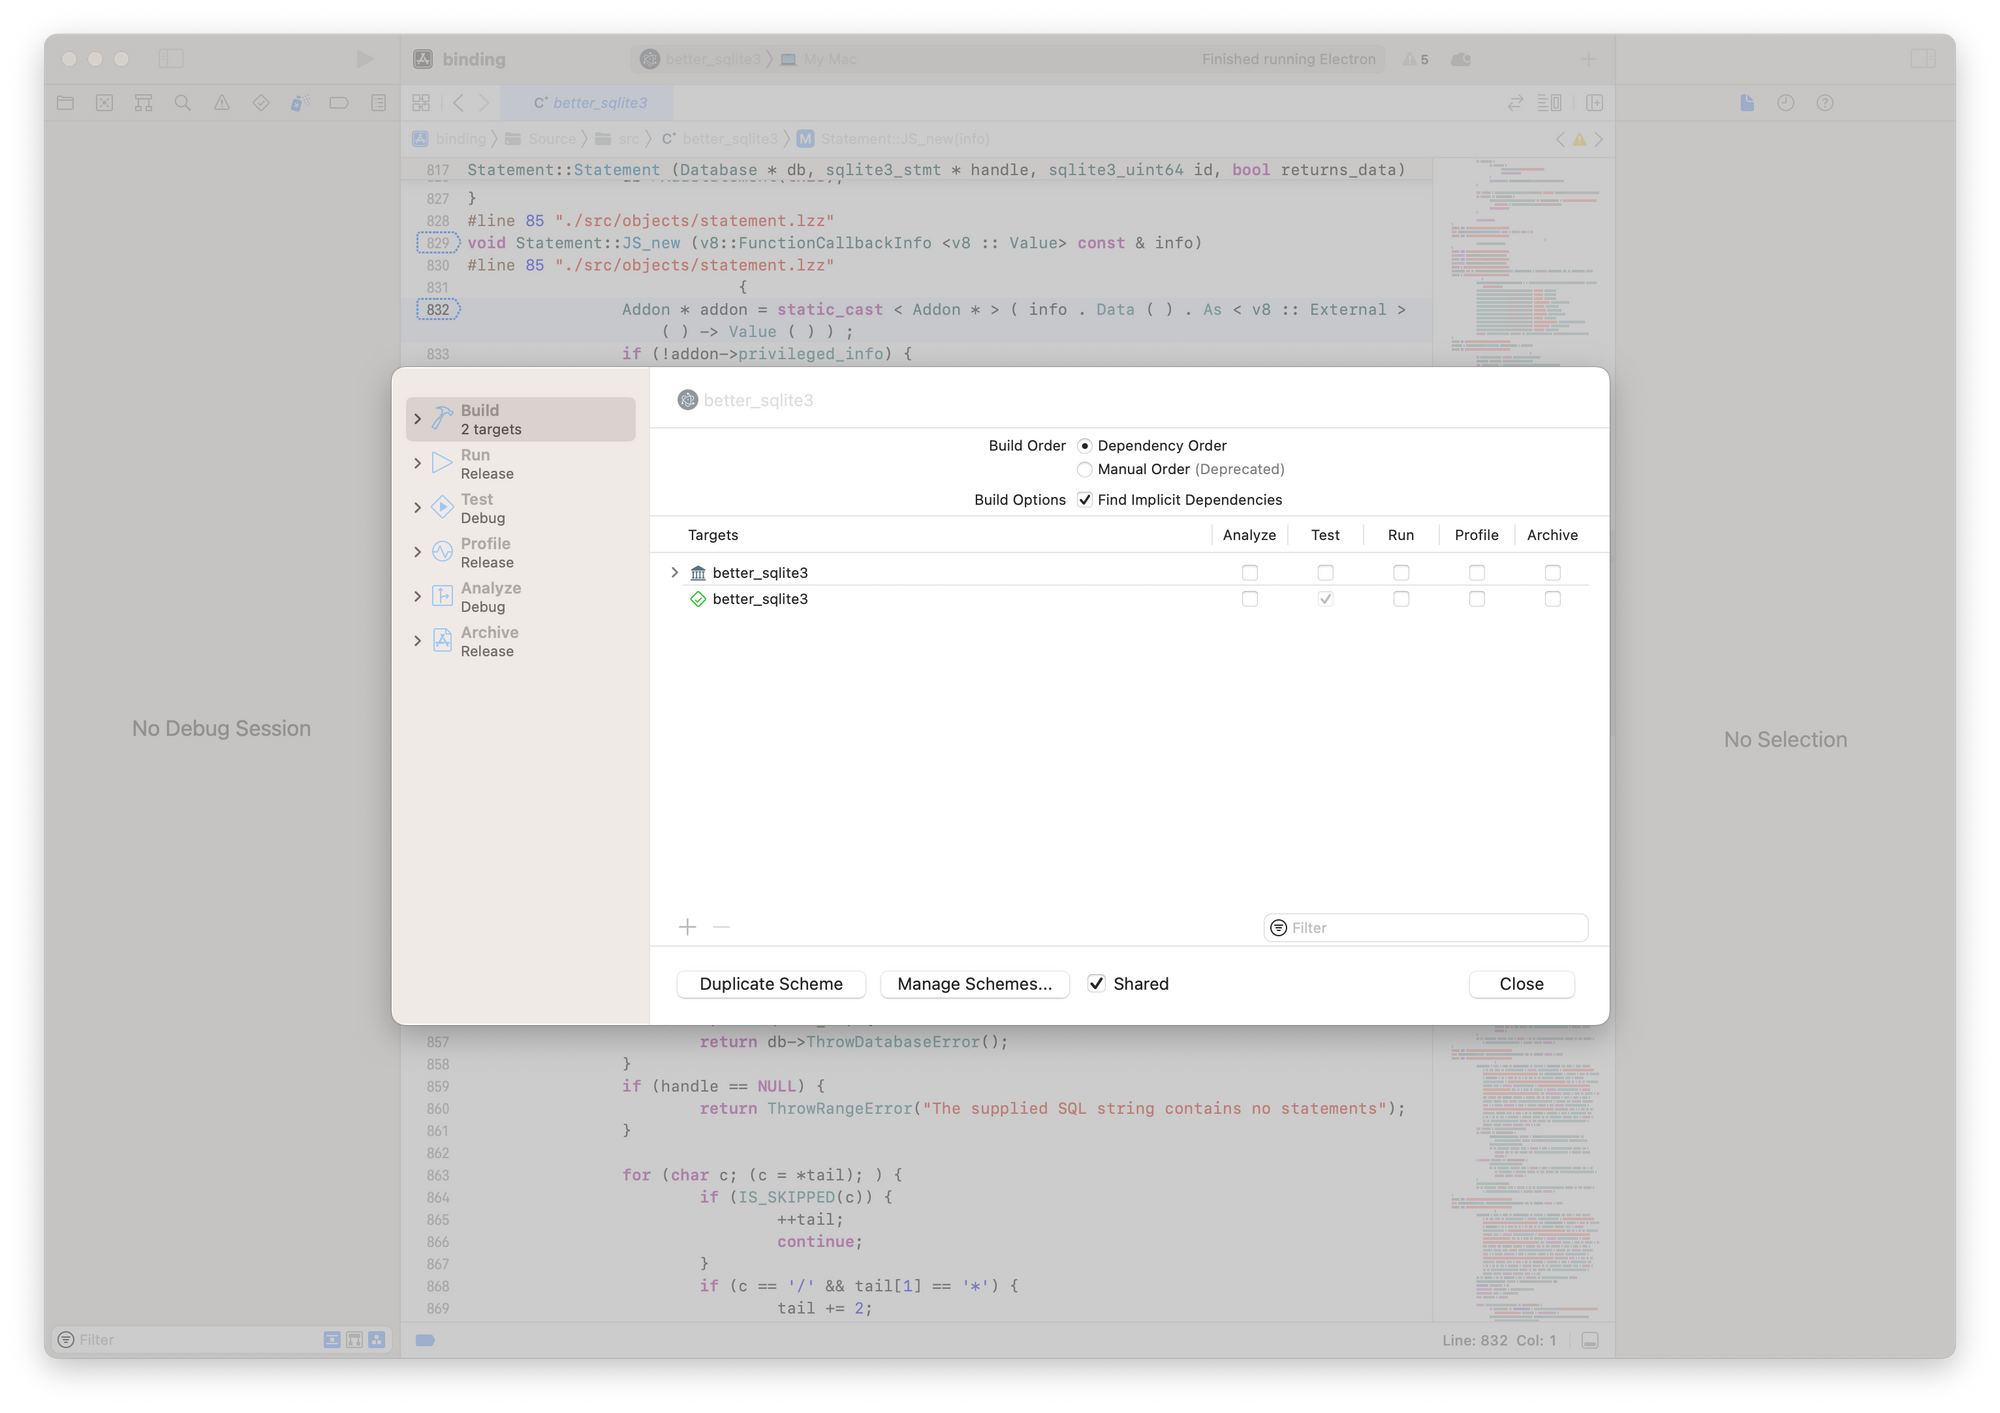
Alternatively, simply disable the automatic build:
Now, you're ready to use Run Without building. And just like that, we're debugging Electron directly in Xcode: